MS-ESS2-5 • Grades 6–8

Humidity, Storms & Temperature

Humidity, storm systems, and temperature are three of the most directly observable aspects of weather — students encounter all three daily but rarely understand the mechanisms behind them. This page covers dew point, the three major storm types, temperature scales, and the global patterns of El Niño and La Niña.

Topic 1

Humidity & Dew Point

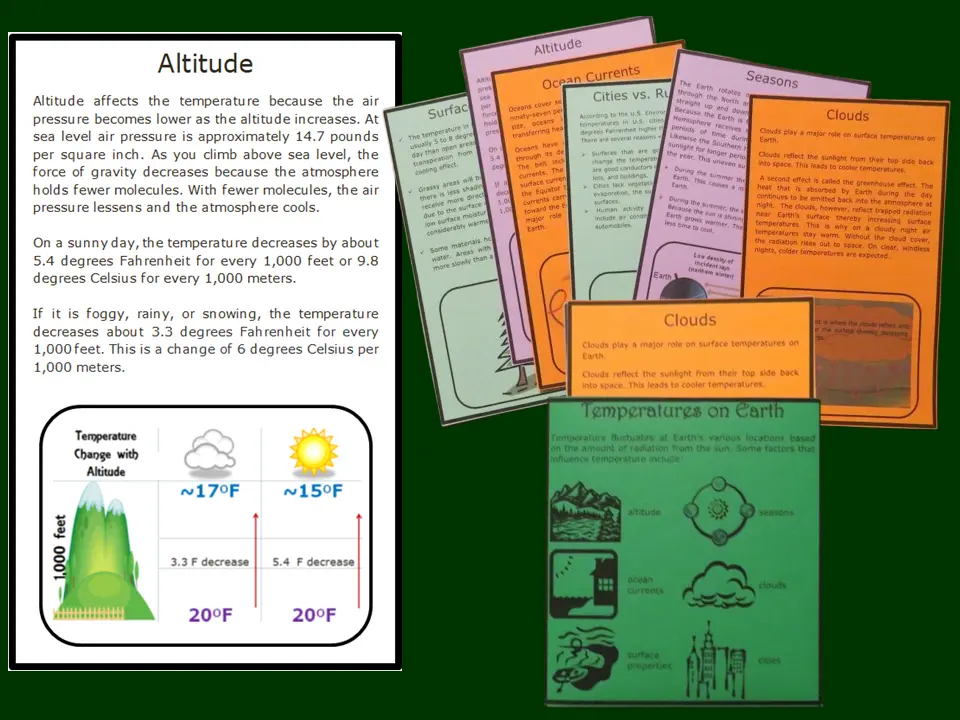
Humidity measures how much water vapor is in the air. The dew point is the temperature at which that water vapor begins to condense — and it's one of the most useful numbers in a weather forecast for predicting fog, frost, and precipitation.

Humidity four-flap organizer and dew point poster

Humidity Four-Flap Organizer

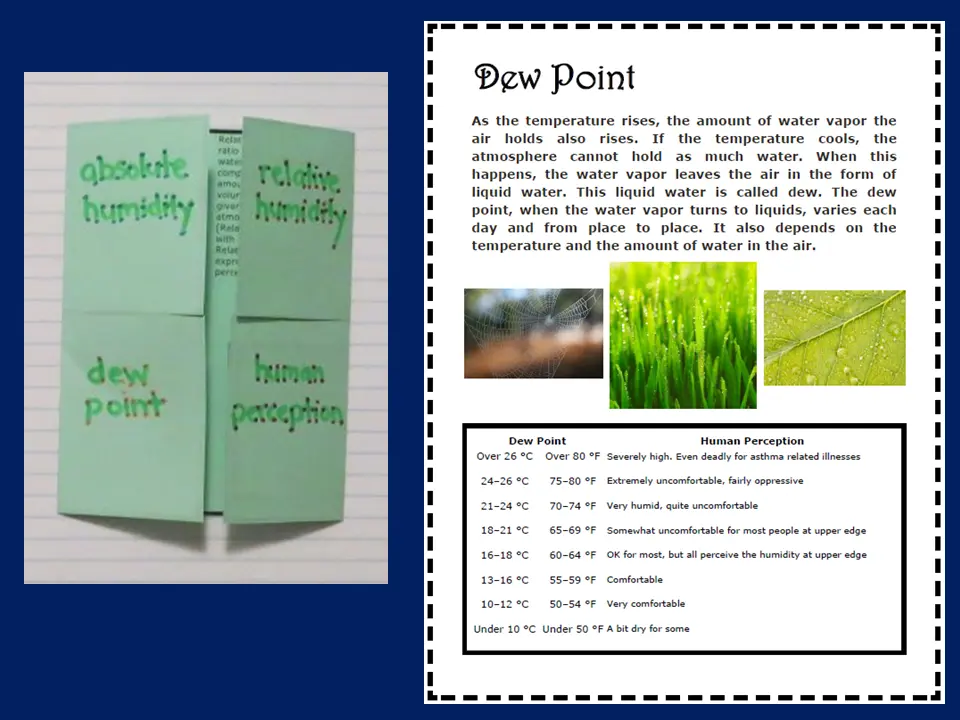
Covers humidity, relative humidity, dew point, and the experiment — one concept per flap with definitions, diagrams, and student notes.
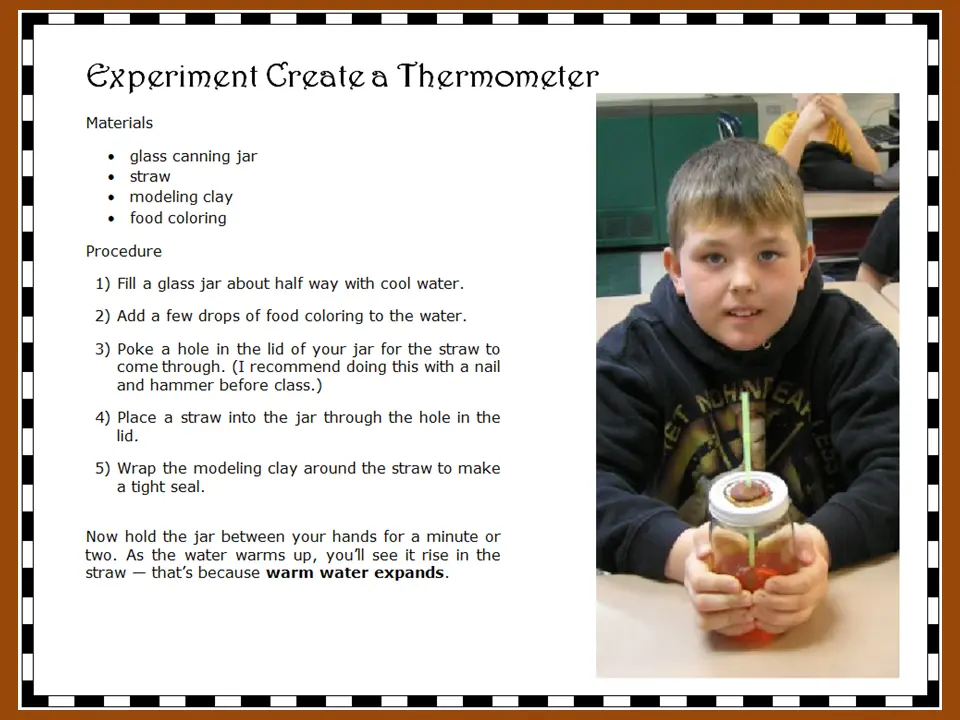
Build a thermometer experiment

Build a Thermometer

Students construct a simple thermometer using a jar, straw, and food coloring — then observe how temperature changes make liquid rise and fall.

Relative humidity vs. dew point

Relative humidity tells you what percentage of the maximum possible water vapor the air currently holds — but that maximum changes with temperature. Dew point is more useful because it's a fixed number: if the temperature drops to the dew point, condensation begins. A dew point above 65°F feels humid; above 75°F is oppressive. Meteorologists prefer dew point because it doesn't change as the temperature rises and falls through the day.

Topic 2

Comparing Storm Systems

Thunderstorms, tornadoes, and hurricanes are all driven by the same basic energy source — warm, moist air rising rapidly. What separates them is size, formation conditions, and the scale of destruction they can cause.

Comparing three types of storms Three columns comparing thunderstorms, tornadoes, and hurricanes by size, formation, and wind speed. Thunderstorm Most common severe storm Size: a few miles across Local scale Forms: warm moist air rises rapidly Winds: up to 60 mph Lightning always present Tornado Most violent winds on Earth Size: 100–500 feet wide Very narrow path Forms: inside severe thunderstorms Winds: up to 300 mph EF0 to EF5 scale Hurricane Largest storm system Size: up to 500 miles wide Regional scale Forms: warm tropical ocean water (80°F+) Winds: 74+ mph Category 1–5 scale

Storm Organizers & Check for Understanding

Hurricane organizer and check for understanding

Hurricane Organizer & Check for Understanding

Covers hurricane formation, the Saffir-Simpson scale, storm surge, and the conditions that strengthen or weaken a hurricane — with a structured Check for Understanding.

Tornado organizer and check for understanding

Tornado Organizer & Check for Understanding

Covers tornado formation from supercell thunderstorms, the Enhanced Fujita scale, tornado alley, and safety procedures — with a structured Check for Understanding.

Comparing hurricanes, thunderstorms, and tornadoes three-flap organizer

Comparing Storms — Three-Flap Organizer

A three-flap foldable lets students compare all three major storm types side by side — recording formation conditions, characteristics, and geographic locations for each.

Topic 3

Temperature, Scales & Experiments

Temperature activities range from understanding why cities are warmer than surrounding rural areas to building a thermometer and measuring temperatures across different locations — connecting classroom science to real-world observation.

City vs rural temperature poster

City vs. Rural Temperature Poster

Explains the urban heat island effect — why cities run 1–7°F warmer than surrounding areas due to pavement, buildings, and reduced vegetation.

Temperature fact cards with storage pocket

Temperature Fact Cards

A set of reference cards covers Celsius vs. Fahrenheit conversion, record temperatures, and temperature patterns on Earth — stored in a pocket organizer.

El Niño and La Niña comparison organizer

El Niño & La Niña Organizer

A two-flap organizer compares El Niño and La Niña — how each shifts Pacific Ocean temperatures and what weather effects each causes across North America.

  El Niño

  • Warmer than normal Pacific Ocean surface
  • Wetter winters in southern US
  • Drier conditions in northern US and Canada
  • Suppresses Atlantic hurricane activity

  La Niña

  • Cooler than normal Pacific Ocean surface
  • Drier winters in southern US
  • Wetter conditions in Pacific Northwest
  • Increases Atlantic hurricane activity
MS-ESS2-4 • MS-ESS2-5 • MS-ESS2-6 • Grades 6–8

Want the Complete Weather & Climate Unit?

This page is one part of a full NGSS-aligned unit covering the hydrologic cycle, atmospheric layers, air pressure, fronts, storms, humidity, temperature, climate patterns, and more — with hands-on experiments, foldable organizers, vocabulary tools, and Check for Understanding pages throughout.

View the Full Unit on TPT