Climate isn't random — it follows predictable patterns driven by latitude, proximity to oceans, and the movement of large air masses across the planet. Understanding these patterns explains why Seattle is rainy, why Denver is dry, and why coastal cities rarely experience the temperature extremes of inland cities at the same latitude.
The most powerful single factor controlling climate is latitude — how far a location is from the equator. Latitude determines the angle at which sunlight strikes Earth's surface, which determines how much energy is received and therefore how warm or cold a place tends to be.
A card fold organizer covers latitude and climate patterns, while a staggered flip organizer covers global air flow patterns and the jet stream — the high-altitude river of air that steers weather systems across North America.
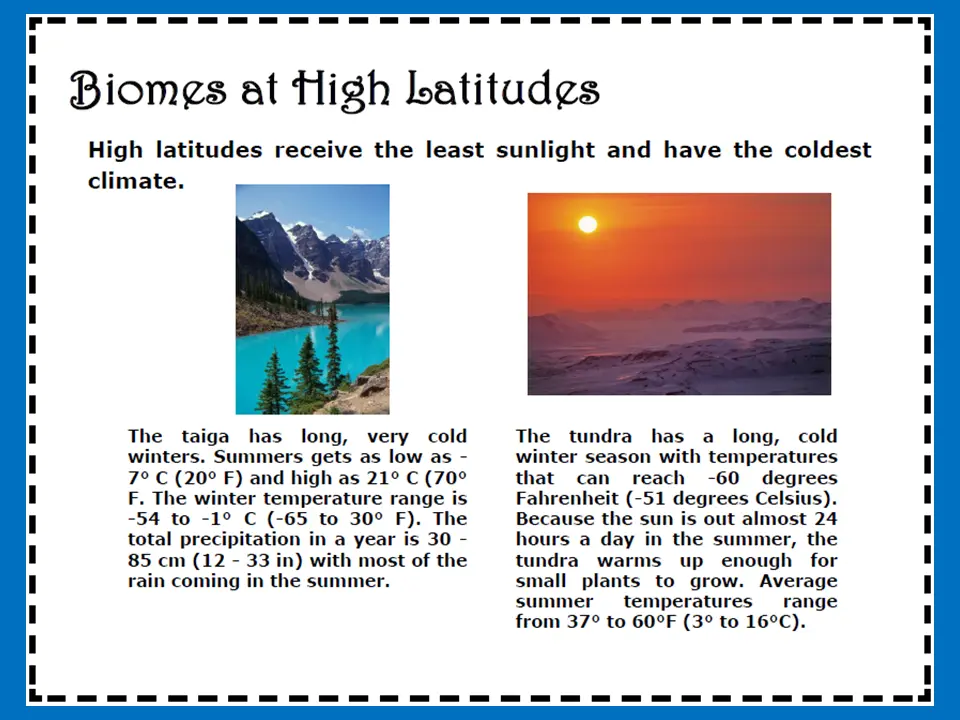
Teaching posters show how latitude determines biome type — from tropical rainforests near the equator to tundra and polar ice at high latitudes, with temperature ranges for each.
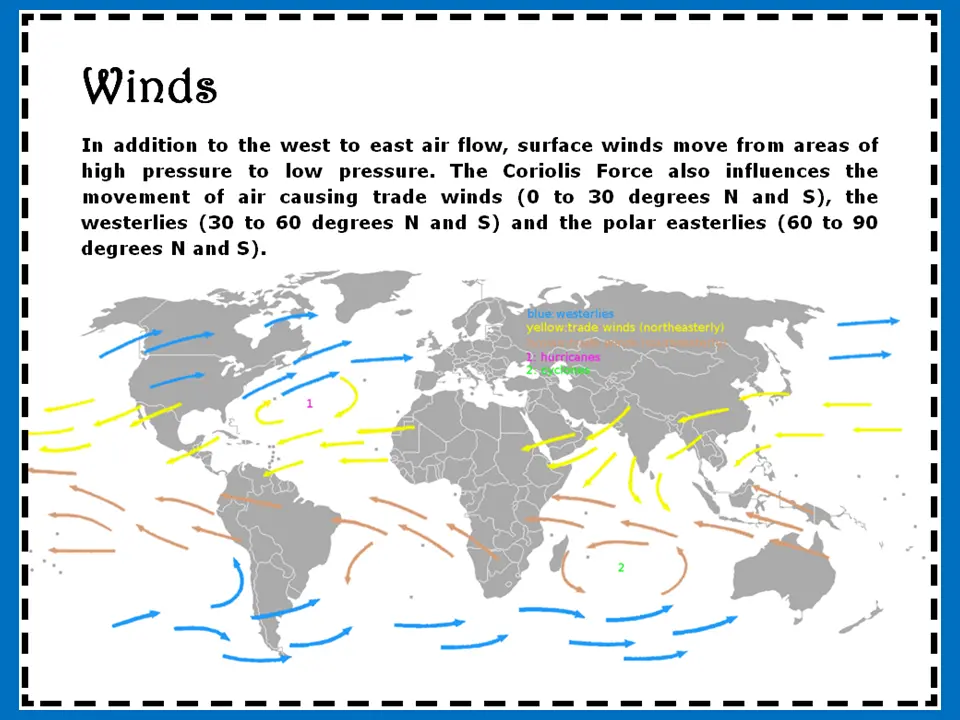
Shows global wind belt patterns — trade winds, westerlies, and polar easterlies — alongside ocean current patterns driven by those same winds.
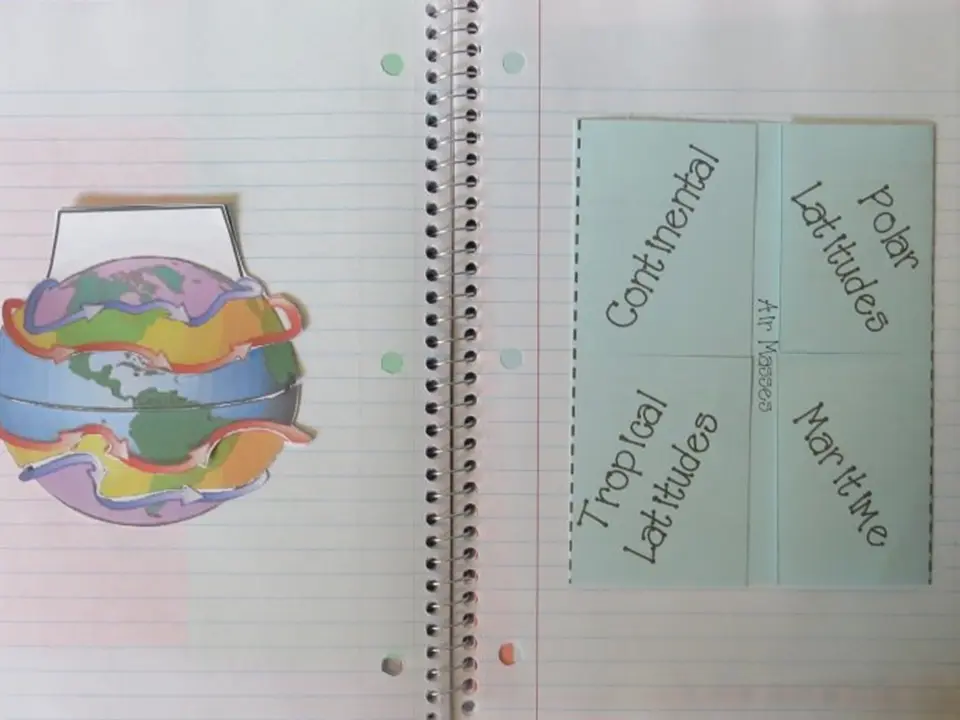
A four-flap staggered organizer covers each major air mass type — continental polar, maritime polar, continental tropical, and maritime tropical — with source regions and weather effects.
The jet stream is a fast-moving river of air in the upper troposphere, typically flowing west to east at 100–250 mph. It forms at the boundary between cold polar air and warm subtropical air. When the jet stream dips south, cold Arctic air spills down into the US — when it lifts north, warm weather follows. Tracking the jet stream is one of the most important tools in modern weather forecasting.
Air masses are classified by two characteristics: whether they formed over land (continental — dry) or water (maritime — moist), and whether their source region was polar (cold) or tropical (warm). The combination gives four main types, each bringing a distinct weather signature when it moves over a region.
A data-driven project asks students to compare the temperature and precipitation records of coastal cities to landlocked cities at the same latitude — making the moderating effect of oceans on climate visible in real data.
This page is one part of a full NGSS-aligned unit covering the hydrologic cycle, atmospheric layers, air pressure, fronts, storms, humidity, temperature, climate patterns, and more — with hands-on experiments, foldable organizers, vocabulary tools, and Check for Understanding pages throughout.
View the Full Unit on TPT