MS-ESS2-5 • Grades 6–8

Fronts & Data Collection

Weather fronts are the boundaries between air masses — and they're where most of the action in weather forecasting happens. Learning to read front symbols on a weather map, detect an approaching front, and collect real weather data are three of the most practical skills in this unit.

Warm Fronts vs. Cold Fronts

A front is the boundary where two air masses of different temperature and humidity meet. The type of weather a front produces depends on which air mass is advancing and the angle at which the two masses meet.

Warm and cold weather fronts Side-by-side diagrams of warm and cold fronts showing air mass movement, slope angle, map symbols, and resulting weather for each type. Warm Front Warm air advances, rides over cold air Warm air Cold air Gradual slope — wide area of light rain or drizzle before front arrives Warmer, humid air follows passage Cold Front Cold air advances, wedges under warm air Warm air forced up rapidly Cold air Steep slope — narrow band of heavy rain or thunderstorms Cooler, drier air follows passage Temperature, wind direction, and air pressure all change noticeably as a front passes.

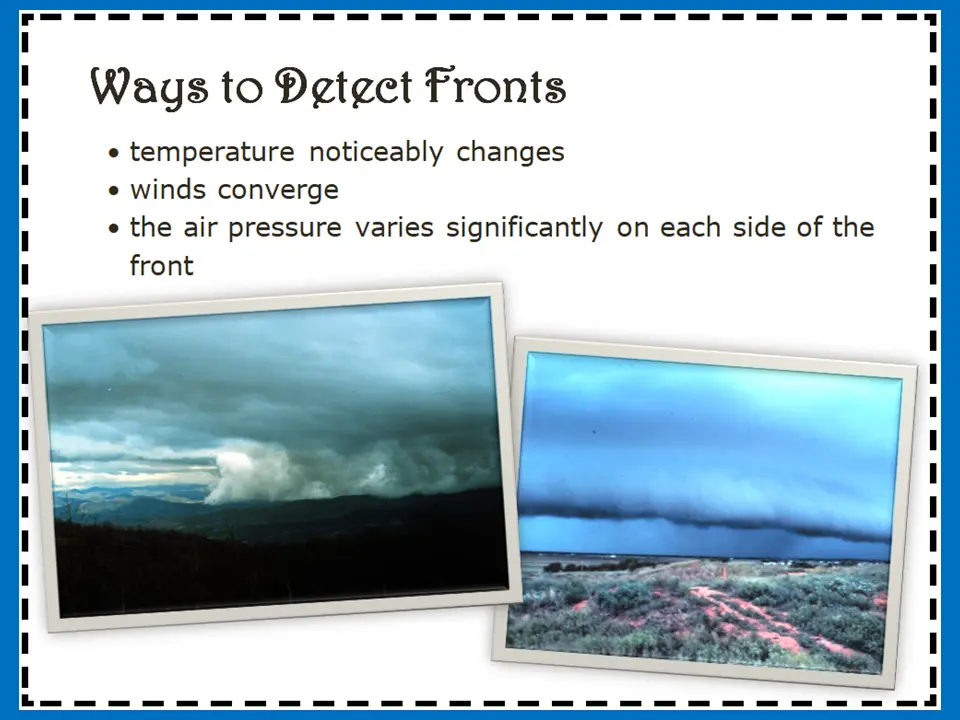
How to Detect an Approaching Front

You don't need a weather station to know a front is coming. Three reliable clues show up before a front arrives — and students learn to use all three as part of the data collection project.

  Temperature

Temperature changes noticeably as a front approaches and passes — sometimes by 10°F or more within a few hours.

  Wind convergence

Winds from different directions converge along a front boundary, often shifting direction suddenly as the front passes.

  Air pressure

Air pressure drops before a front arrives and rises after it passes — a falling barometer is one of the oldest weather forecasting tools.

Ways to detect fronts poster with storm photos
Warm and cold fronts Venn comparison organizer

Weather Data Collection Project

Students collect real weather data every day for a week — recording temperature, cloud cover, air pressure, precipitation, and more — then use their data to identify patterns and answer structured questions in the Check for Understanding.

  1. Students receive the Weather Data Collection Chart and learn which measurements to record each day.
  2. Each day the class records outdoor conditions — temperature, cloud type, precipitation, wind direction, and air pressure from the classroom barometer.
  3. Students note any significant weather events and look for connections between measurements — for example, dropping pressure before precipitation.
  4. At the end of the week, students complete the Check for Understanding using their collected data as evidence.
Weather data collection chart

Data Collection Chart

A structured weekly chart with rows for each weather variable students measure daily.

Weather Maps & Check for Understanding

A US weather map activity with removable cards gives students practice placing weather events in the correct locations, while the Check for Understanding page connects their data collection observations to the weather patterns they've been studying.

Weather data collection check for understanding

Data Collection Check for Understanding

Structured questions guide students to analyze their week of weather data, identify patterns, and explain relationships between variables using evidence from their own records.

US weather map with event placement cards

US Weather Map with Event Cards

Students place cards showing blizzards, tornadoes, nor'easters, hurricanes, and extreme weather events in their correct geographic locations on a US map.

MS-ESS2-4 • MS-ESS2-5 • MS-ESS2-6 • Grades 6–8

Want the Complete Weather & Climate Unit?

This page is one part of a full NGSS-aligned unit covering the hydrologic cycle, atmospheric layers, air pressure, fronts, storms, humidity, temperature, climate patterns, and more — with hands-on experiments, foldable organizers, vocabulary tools, and Check for Understanding pages throughout.

View the Full Unit on TPT